Sunday, 29 May 2016

Ministry exam practise and answer key: 2012/2013

https://sites.google.com/site/socialstudiesfornonarabs/ministry-exams


                              How to write film review 29/5


http://www.wikihow.com/Write-a-Movie-Review

Read the sample 'Dark Knight' review (First one) then read article about how one is constructed.

Tuesday, 24 May 2016

Monday, 23 May 2016


How to make a paper catapult

https://www.youtube.com/watch?v=gjEME1HIsQ8
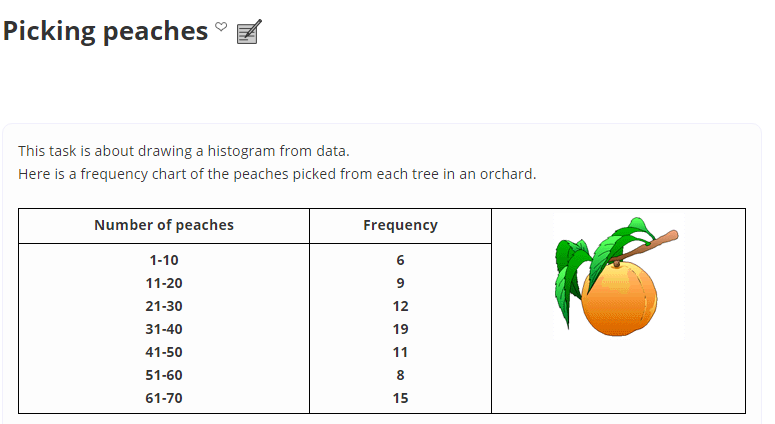
                                 Monday 23/ 5 Graphing quantitative data: Histogram

 Histograms are used to show distributions of variables while bar charts are used to compare variables. Histograms plot quantitative data with ranges of the data grouped into bins or intervals while bar charts plot categorical data.

Quantitative data is information about quantities; that is, information that can be measured and written down with numbers. Some examples of quantitative data are your height, your shoe size, and the length of your fingernails.


Task:


Draw a histogram to represent this data. Remember to include title and label axis.

                                                Chemistry- Chemical reactions 23/5


The unbelievably exciting video from today.

https://www.youtube.com/watch?v=qVWkTBSRElo

Be sure to take notes, particularly of the new keys words as you will need to know what they are tomorrow.