Monday 23/ 5 Graphing quantitative data: Histogram
Histograms are used to show distributions of variables while bar charts are used to compare variables. Histograms plot quantitative data with ranges of the data grouped into bins or intervals while bar charts plot categorical data.
Quantitative data is information about quantities; that is, information that can be measured and written down with numbers. Some examples of quantitative data are your height, your shoe size, and the length of your fingernails.
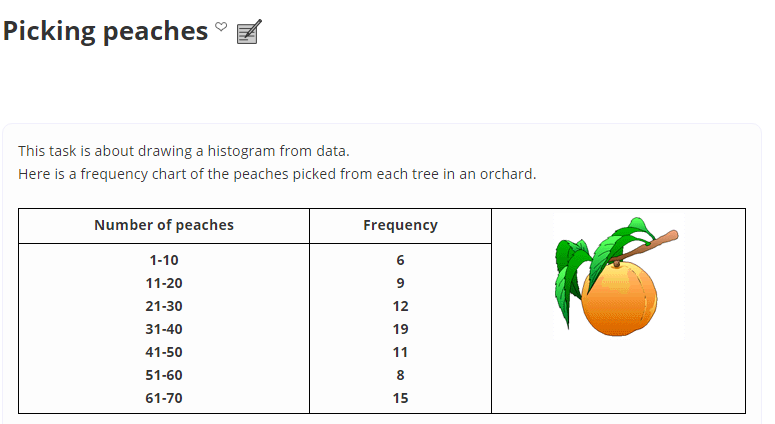
Task:

Draw a histogram to represent this data. Remember to include title and label axis.
Histograms are used to show distributions of variables while bar charts are used to compare variables. Histograms plot quantitative data with ranges of the data grouped into bins or intervals while bar charts plot categorical data.
Quantitative data is information about quantities; that is, information that can be measured and written down with numbers. Some examples of quantitative data are your height, your shoe size, and the length of your fingernails.
Task:
Draw a histogram to represent this data. Remember to include title and label axis.
No comments:
Post a Comment